When you are in the process of building an application that needs to provide a lot of information for users, it is often a reflex to use tables with rows of data. This is a pattern that is useful for a lot of people and you can easily copy the data to a spread sheet and make use of the information in different manipulations afterward. But this can be a bit dull to look at and not very appealing.
In fact, to quickly assess the state of your data, the usage of charts and graphs are far more appropriate. Charts are powerful components for an application which aggregate your data in useful representations. For example, a set of data with multiple values that forms a total is easier to assimilate when you look at the same data in a pie chart.
I am currently working on our RAC/M Identity solution which is, at its core, a data analysis based application. Here is an example of two different ways to present information based on how it is done in our product:
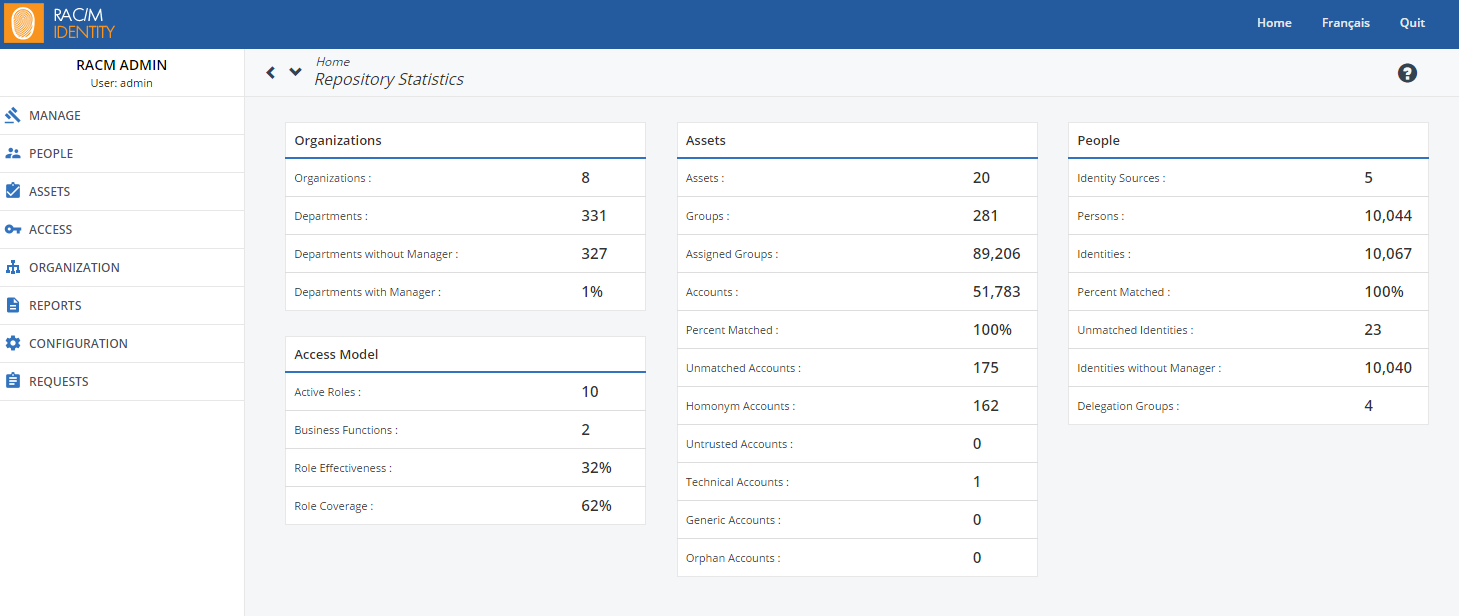
1. Statistics presented in tables, which is pretty acceptable for a lots of people
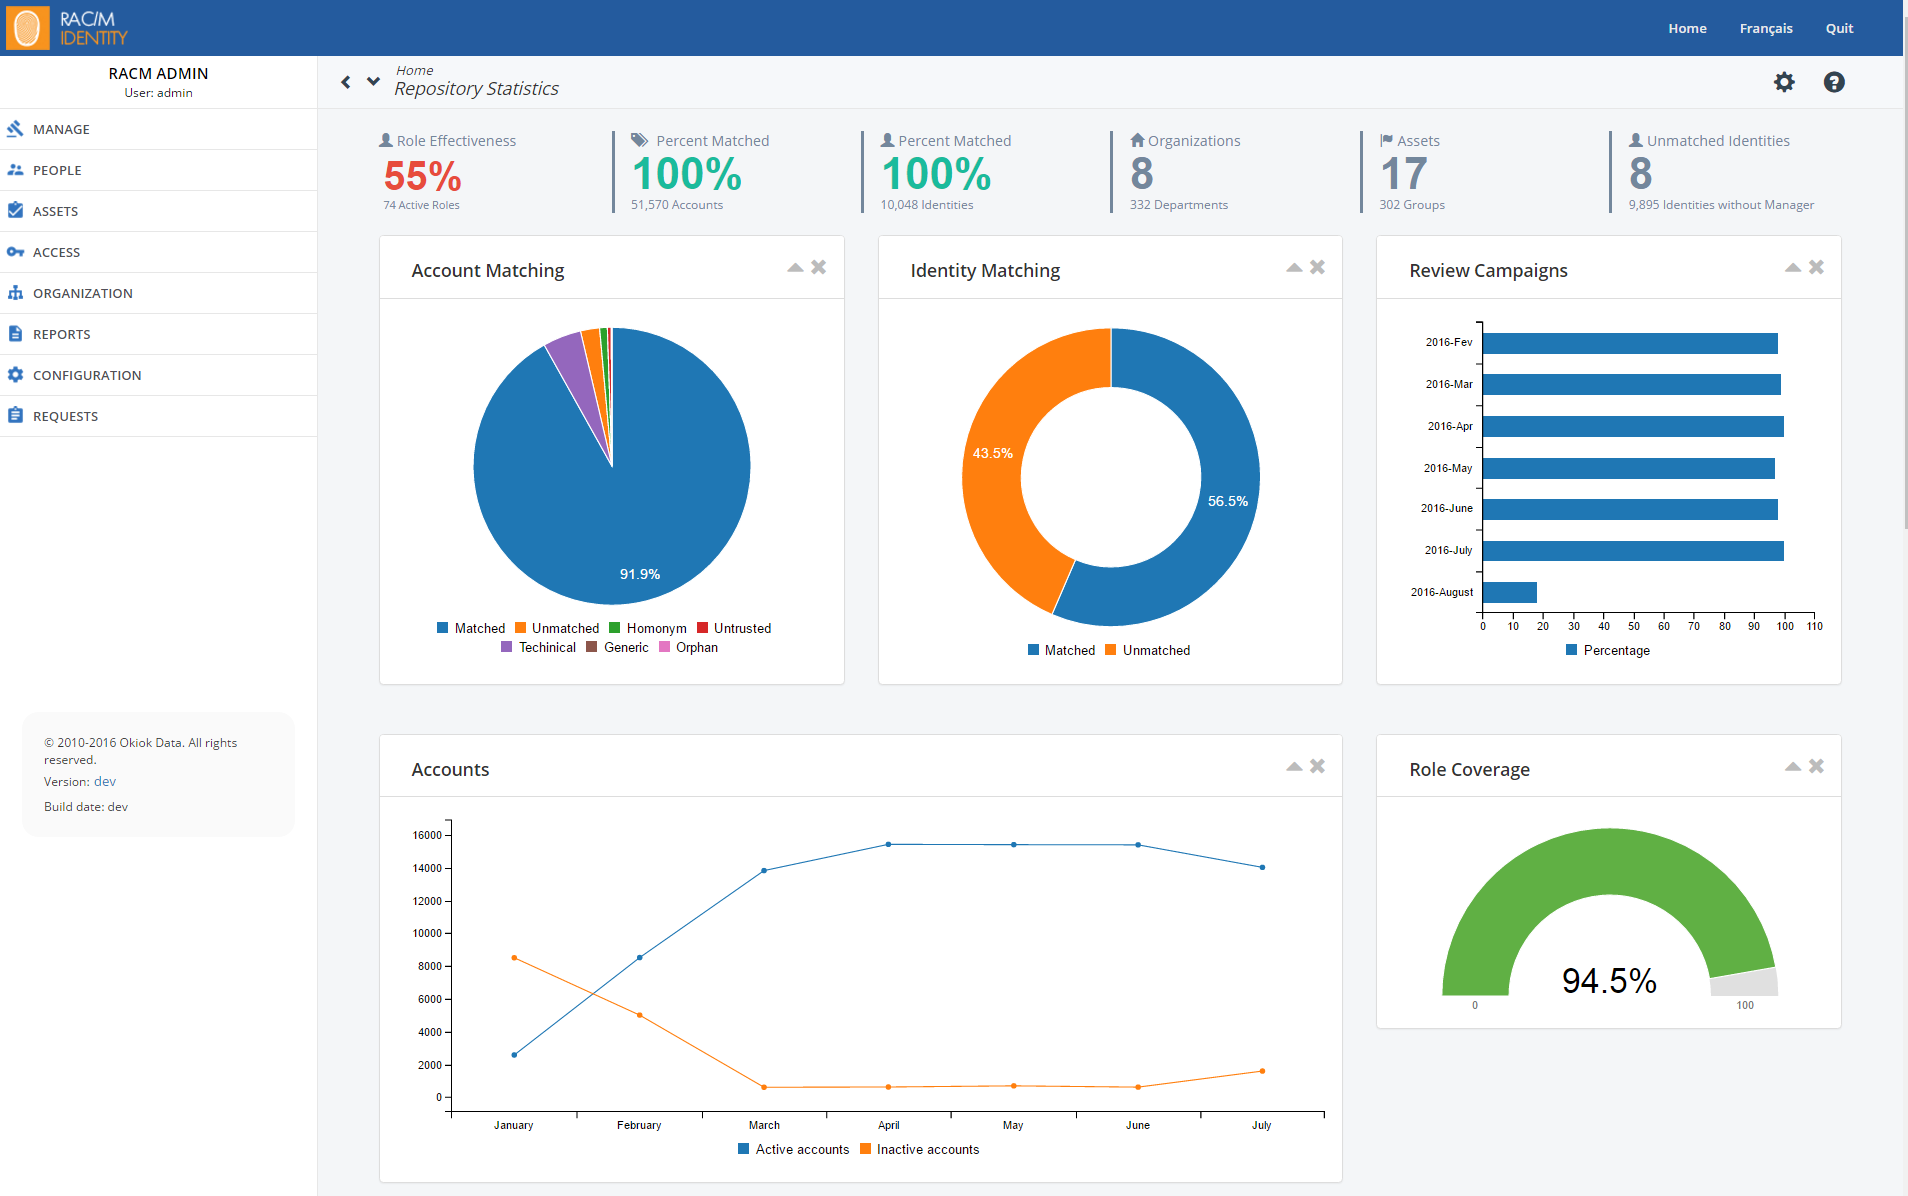
2. A graphics and charts representation of the same information
What we can see by looking at these images is that the second image presents a more appealing load of information. In my work environment, there is a distinct interest from upper management for the second way of showing statistics and its becoming a requirement from our customers that we provide such representations of business critical data.
Solutions explored
To achieve these charts, I’ve recently worked with two free libraries that provide the necessary features: Morris.js and C3.js.
- Complexity: Simple
- Type of charts provided : Area, Bar, Donut and Line
- Compatibility: This library is based on jQuery and Raphael and will run in any browser.
I used this library for a specific customer application that was to run in an embedded system. The requirement was to have these charts be able to run in any browser. The integration was very simple. We only need to reference jquery, raphael and morris in the html header and we were ready to go. The Morris web site has all the references necessary to implement those charts with examples.
C3.js :
- Complexity: Medium
- Type of charts provided : Area, Bar, Donut, Gauge, Line, Pie and Step
- Compatibility: This library is based on D3 and thus will require modern browsers that support SVG
This is the library that I’m currently using in RAC/M Identity for the charts that you can see above in the second image. Its a very powerful library that supports data that can be reloaded very easily based on changing data coming from, for example, Ajax calls.
Specific implementation
With the final part of this post, we will technically look at how to integrate C3.js in a project with a very simple example.
After you downloaded the C3.js (both the javascript and css sources) and D3.js library, you need to reference them in the header of your HTML document:
1. HTML header initialization
<link type="text/css" rel="stylesheet" media="all" href="/css/c3/c3.min.css">
<script type="text/javascript" src="/javascript/c3/d3.v3.min.js"></script>
<script type="text/javascript" src="/gui/javascript/c3/c3.min.js"></script>
2. Javascript chart definition
To initialize a chart we need to write a bit of javascript. The following blocks of code will produce the donut chart present in the image above with the name “Identity Matching”.
        // Identity matching pie charts
	var chartIM = c3.generate({
This will bind your chart to an HTML element. In my case, I’ve bound it to a div called charts3-c3
		bindto: '#charts3-c3',
	    data: {
This is my initial data source. I left matched and unmatched to 0 since I want an animation when the panel loads.
	        columns: [
	            ['Matched', 0],
	            ['Unmatched', 0]
	        ],
“Type donut” identifies this chart as a donut chart,
	        type : 'donut',
	        onclick: function (d, i) { console.log("onclick", d, i); },
	        onmouseover: function (d, i) { console.log("onmouseover", d, i); },
	        onmouseout: function (d, i) { console.log("onmouseout", d, i); }
	    }
	});
This is the location where I put the real statistics of the chart. This is what will generate an animation which shows the donut fill in a looping fashion
	setTimeout(function () {
		chartIM.load({
	    	columns: [
	  	            ['Matched', 28542],
	  	            ['Unmatched', 22000]
	  	        ]
	    });
	}, 500);
Here is the entire above code with no comments:
	var chartIM = c3.generate({
		bindto: '#charts3-c3',
	    data: {
	        columns: [
	            ['Matched', 0],
	            ['Unmatched', 0]
	        ],
	        type : 'donut',
	        onclick: function (d, i) { console.log("onclick", d, i); },
	        onmouseover: function (d, i) { console.log("onmouseover", d, i); },
	        onmouseout: function (d, i) { console.log("onmouseout", d, i); }
	    }
	});
	setTimeout(function () {
		chartIM.load({
	    	columns: [
	  	            ['Matched', 28542],
	  	            ['Unmatched', 22000]
	  	        ]
	    });
	}, 500);
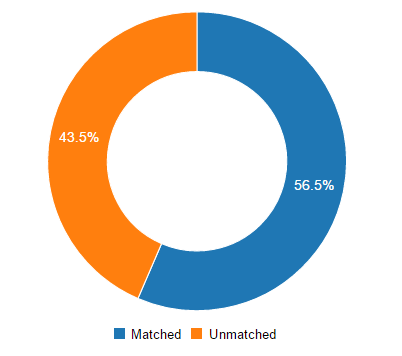 When you load your source file in a web browser, with the above code present in your source, you will have a graph on screen, in the div you identified with charts3-c3, that looks like this:
3. Dynamic data update
Now what can be even better is to have your data update regularly. To do this you can make, for example, an ajax call that polls your data on a regular basis. When your ajax call returns from the server, have the chart be refreshed with this new data with the help of the load function.
Example:
    ...
    // Ajax return call that initialize newMatchedData abd bew UnmatchedData
    var newMatchedData = ...;
    var newUnmatchedData= ...;

    chartIM.load({
        columns: [
	    ['Matched', newMatchedData],
            ['Unmatched', newUnmatchedData]
        ]
    });
...
This will have the effect of changing the chart dynamically.
Conclusion
In conclusion, to answer the original question of this blog, having charts in a web site or web based application is not really difficult nowadays with the different libraries that exists and it should certainly not be overlooked in your design process.
It really uplifts your project to the next level!


